Using JFR and JMC to root cause a performance bug in JMC caused by a typo in JFR
When you open a profile in JMC, it normally takes a few seconds, but there are some profiles that JMC struggles to load. This happens when a profile contains events which violate an assumption made in JMC’s parser: events on the same thread are almost always disjoint in their durations. When JMC parses a JFR file, it splits the events of the same type emitted on the same thread into lanes so that events within a lane are disjoint. JMC can handle overlapping events, but assumes this essentially never happens, and exhibits quadratic scaling when events overlap.
The good news is that unless you hack it into the JFR file generation in your own customisation of async-profiler, it’s practically impossible to generate events that violate this assumption. However, if you run this code:
    public static void main(String... args) throws Exception {
        if (args.length < 1) {
            System.err.println("provide a directory to write the JFR file to");
            System.exit(1);
        }
        try(Recording recording = new Recording()){
            recording.setName("slow");
            recording.setDumpOnExit(true);
            recording.setDestination(getOrCreateDirectory(args[0]).resolve("slow.jfr"));
            recording.enable("jdk.FileWrite");
            recording.start();
            generateFileEvents();

        }
    }

    private static void generateFileEvents() throws IOException {
        Path directory = Files.createTempDirectory("files");
        for (int i = 0; i < 100 * 1000; i++) {
            try (RandomAccessFile file = new RandomAccessFile(directory.resolve(i + "").toFile(), "rw")) {
               file.write(("data" + i).getBytes(StandardCharsets.UTF_8));
            }
        }
    }

    private static Path getOrCreateDirectory(String dir) throws IOException {
        Path destination = Paths.get(dir);
        if (!Files.exists(destination)) {
            Files.createDirectory(destination);
        }
        return destination;
    }
And then open the .jfr file in JMC, you will see this for quite some time (well over 30s):

Fortunately JMC itself can be profiled as it is loading a profile, using JFR with the command:
jcmd <pid of JMC> JFR.start settings=profile filename=jmcrecording.jfr duration=60s
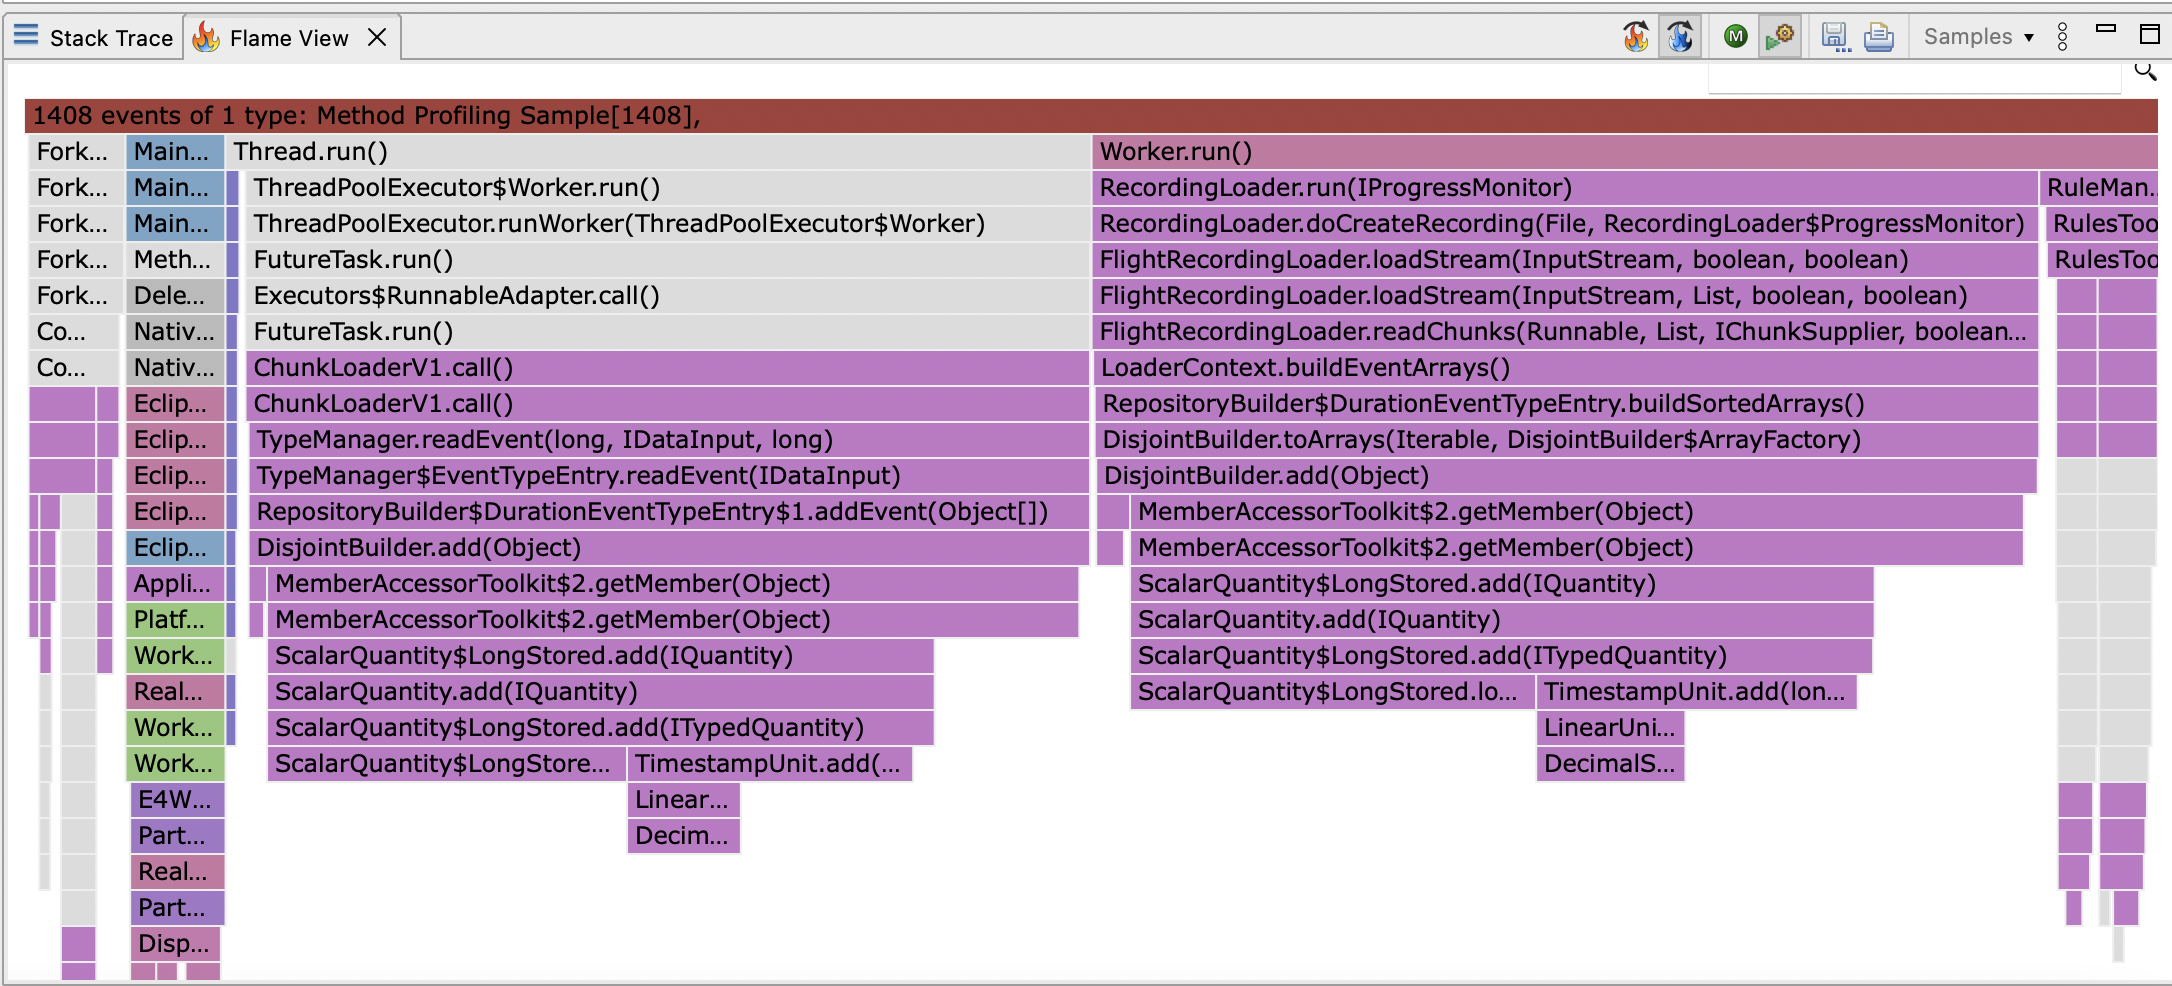
After 60s a profile will be dumped containing execution samples of whatever JMC spent its time doing. Loading the profile of JMC itself and navigating to Method Profiling:
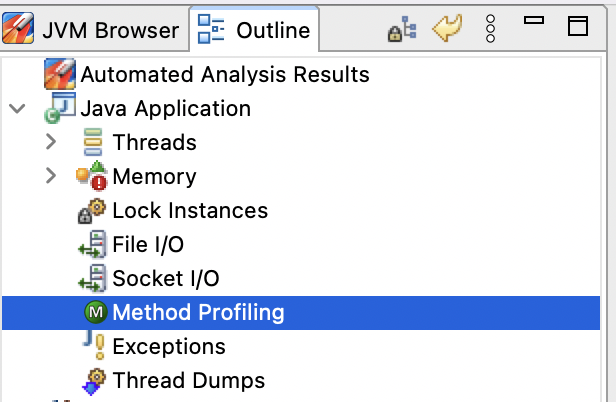
This shows you a flamegraph of CPU samples:
There are over 6000 samples, which is a good number for a JFR CPU profile, which takes samples at about 100Hz.
If most activity is during loading the profile is on the same thread, at 100Hz, having 6000 samples means we got one sample every 10ms so don’t have a lot of failed samples, which JFR doesn’t otherwise account for.
Assuming there is no JNI activity, this means the profile should be reasonably accurate.
It’s tempting to scroll to the bottom and look for the widest frame and optimise it.
The obvious candidate here are the calls to ImpreciseScaleFactor.targetNumber, outlined in black below:

Though there is a little fat to trim in this method, this is a red herring; optimising this method would be a waste of time and it would take an heroic effort to move the needle by focusing here. CPU sampling can’t differentiate between a method being slow (requiring constant factors improvements) and being called too often (requiring algorithmic improvements). Unfortunately, JFR offers no way to perform a differential diagnosis to rule out constant factors and focus on algorithmic issues.
Once you have identified a bottleneck, the easiest way to differentiate between a constant factors and algorithmic issue is honestly just to read the code for a few of the frames towards the bottom of the stacktrace.
Sometimes, this is too complicated, and I have resorted to inserting counter probes in these methods with bytebuddy (but I recently discovered async-profiler can do this and I have adopted this approach in preference to instrumentation during analyses).
If you have a superlinear algorithm, you see high hit counts at the leaves, and low hit counts in the interior nodes.
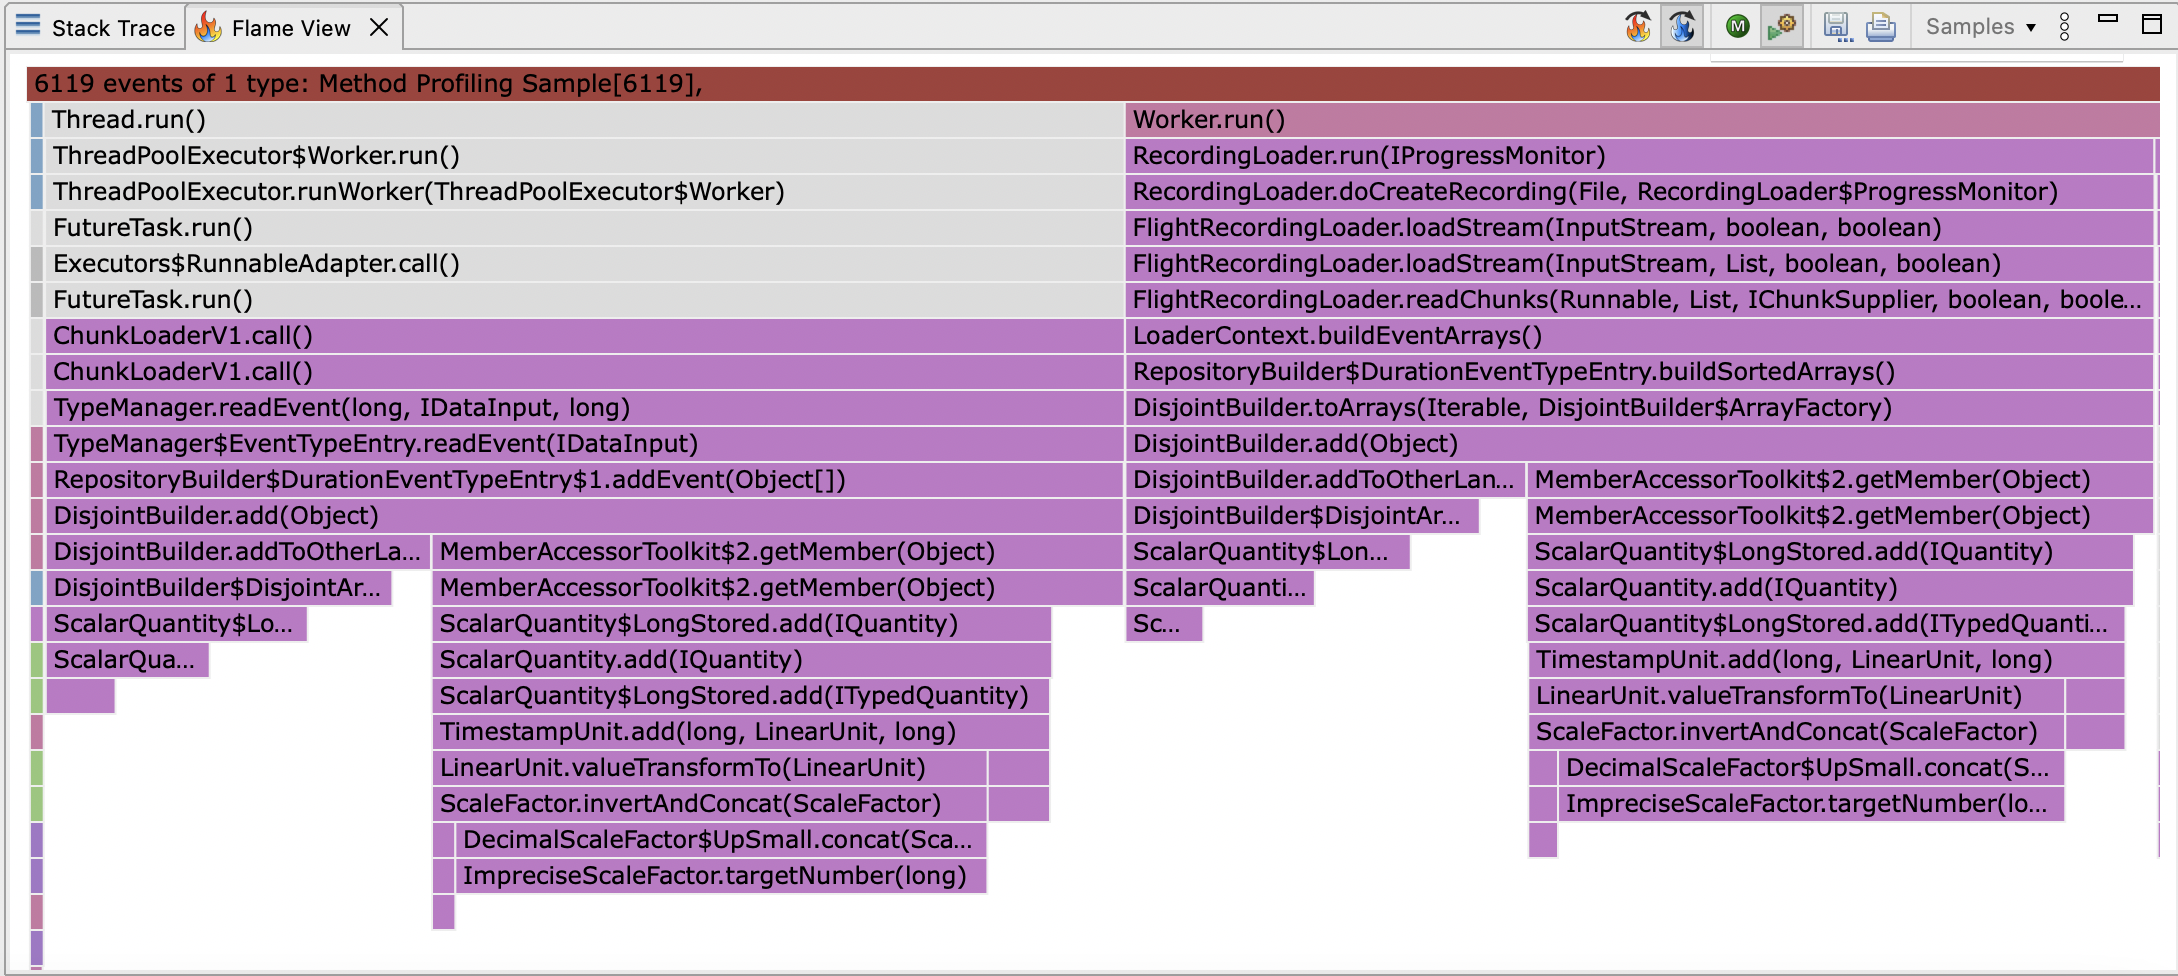
In any case, reading the code for DisjointBuilder.add (outlined in black below):
reveals what looks like an optimisation:
    // at 77580fe1b483b4daf8f46938c297185b01f32304
	public void add(T e) {
		IQuantity start = startAccessor.getMember(e);
		IQuantity end = endAccessor.getMember(e).in(start.getUnit());
		if (noLanes == 0) {
			addToNewLane(e, start, end);
		} else if (!lanes[0].accept(e, start, end)) {
			int changedLane = addToOtherLane(e, start, end);
			sortLanes(changedLane);
		}
	}

	private void sortLanes(int fromIndex) {
		// Sorting the lanes by descending end time
		for (int i = fromIndex; i > 0; i--) {
			if (lanes[i].end.compareTo(lanes[i - 1].end) > 0) {
				DisjointArray<T> tmp = lanes[i - 1];
				lanes[i - 1] = lanes[i];
				lanes[i] = tmp;
			}
		}
	}

	private int addToOtherLane(T e, IQuantity start, IQuantity end) {
		// Try with the other existing lanes
		for (int i = 1; i < noLanes; i++) {
			if (lanes[i].accept(e, start, end)) {
				return i;
			}
		}
		return addToNewLane(e, start, end);
	}

	private int addToNewLane(T e, IQuantity start, IQuantity end) {
		if (noLanes >= lanes.length) {
			lanes = Arrays.copyOf(lanes, (lanes.length * 3) / 2 + 2);
		}
		lanes[noLanes] = new DisjointArray<>(e, start, end);
		return noLanes++;
	}
lanes[0].accept is obviously expected to be the common case (it happens whenever the events are disjoint).
Its implementation appears to be a constant time operation too, assuming the comparator isn’t bizarre:
    boolean accept(T e, IQuantity start, IQuantity end) {
        if (size >= array.length) {
            int newCapacity = array.length < 100 ? array.length * 4 : (array.length * 3) / 2 + 1;
            array = Arrays.copyOf(array, newCapacity);
        }
        if (start.compareTo(this.end) >= 0) {
            array[size++] = e;
            this.end = end;
            return true;
        }
        return false;
    }
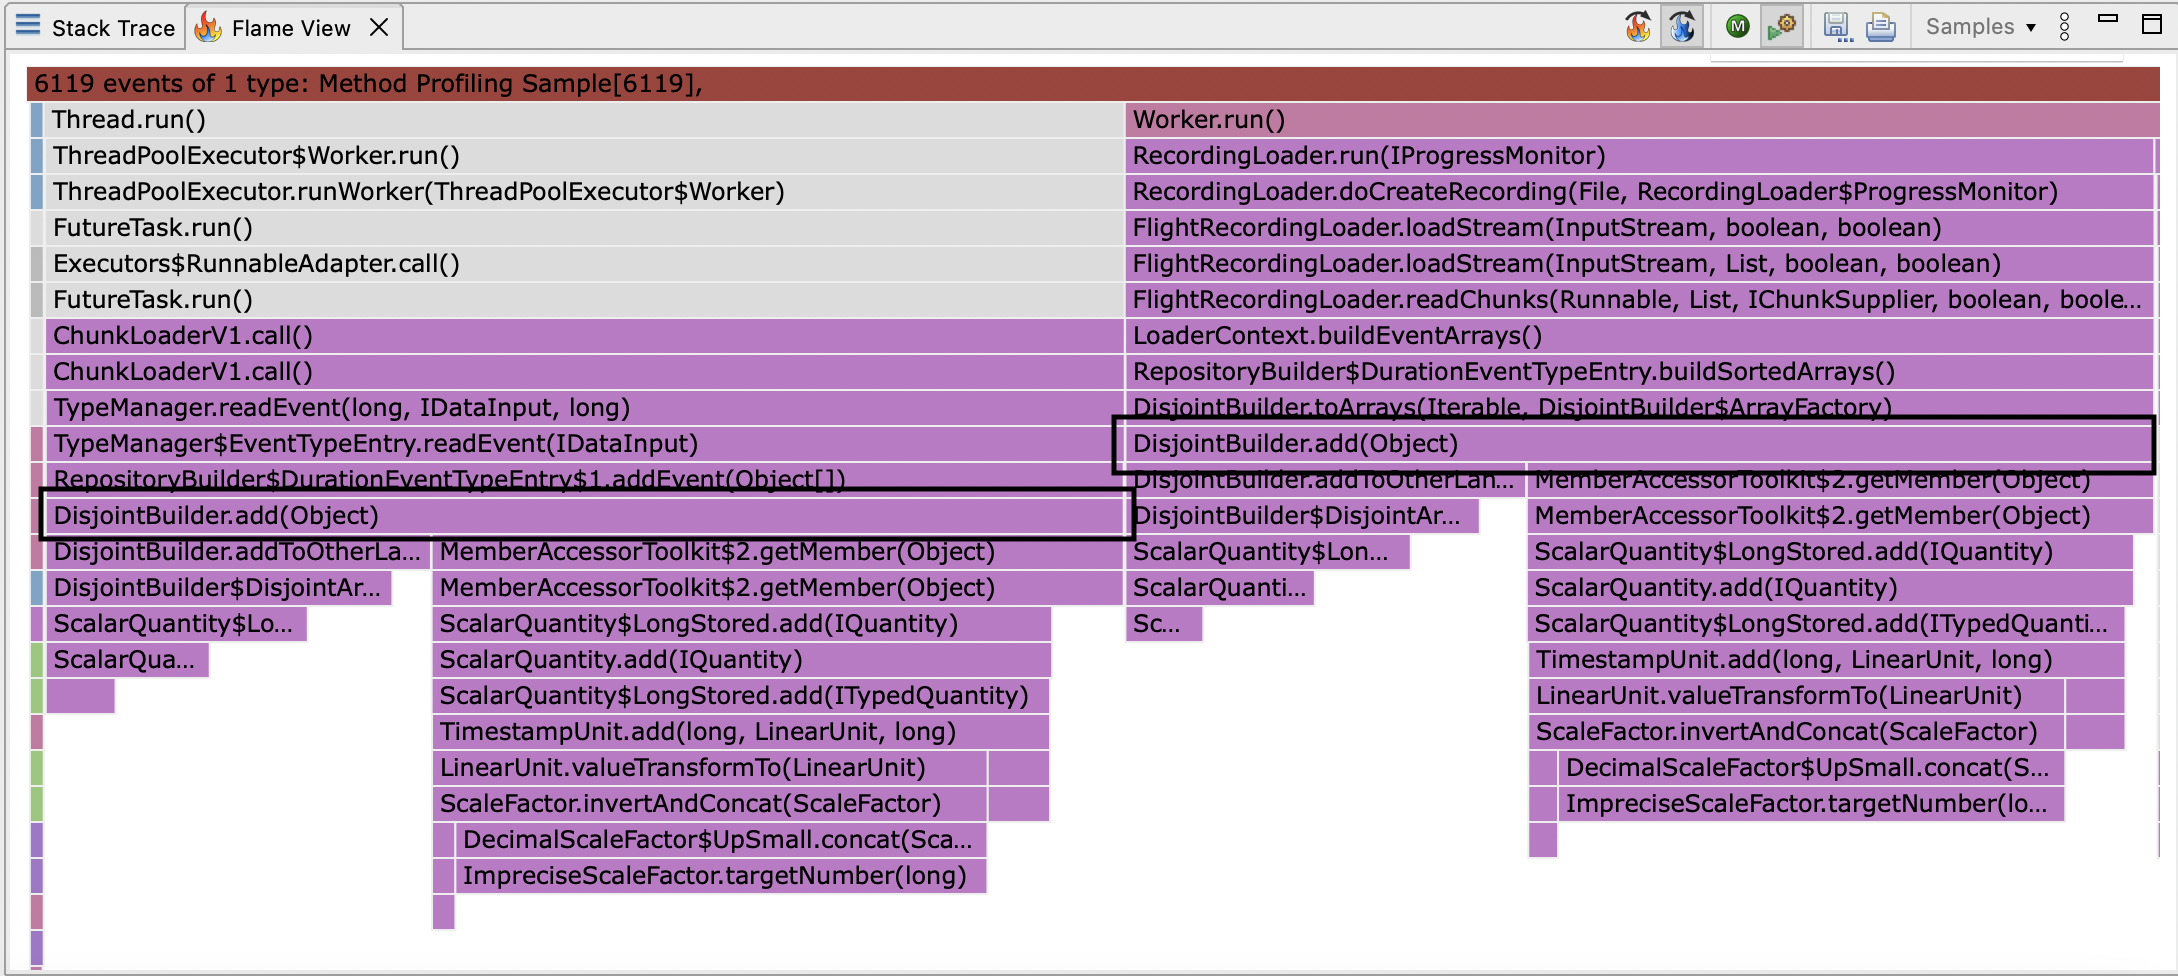
The method addToOtherLane shows up in the flamegraph (outlined in black):
So we must be going down the other branch:
    int changedLane = addToOtherLane(e, start, end);
    sortLanes(changedLane);
addToOtherLane does a linear search for the first lane for which the last event ends before the event being added.
This can obviously be improved by replacing the linear search with binary search, since the sort order of the lanes by end time is maintained.
This doesn’t describe all of the samples though, and it seems strange that so many samples should be in MemberAccessorToolkit$2.getMember, and where is sortLanes?

This only makes sense if sortLanes (which is a quadratic bubble sort) has been inlined.
Knowing that the lanes are maintained in sort order, when a lane needs to move, it’s possible to find where it needs to move to in logarithmic time, and then perform a linear time copy.
This makes the algorithm linear in the number of lanes.
These changes were implemented in JMC-7950, which will be released in as part of JMC 9, and the issue is more or less fixed. If you open the profile generated by the code at the top of the post in JMC 9, it will still be slower to load than you might have hoped, but it will be several times faster. Using JFR to take a profile of JMC loading the same profile after the change produces a much smaller number of samples (JFR also records much less CPU time) and shows different stack traces:
Erik Gahlin pointed out on the issue that jdk.FileWrite events making profiles slow to load must be because of a bug in JFR.
It turned out there has been a bug in JFR since JDK15, introduced here.
The problematic change is here:
     @SuppressWarnings("deprecation")
     @JIInstrumentationMethod
     public void write(byte b[]) throws IOException {
-        FileWriteEvent event = FileWriteEvent.EVENT.get();
-        if (!event.isEnabled()) {
+        EventHandler handler = Handlers.FILE_WRITE;
+        if (!handler.isEnabled()) {
             write(b);
             return;
         }
+        long bytesWritten = 0;
+        long start = 0;
         try {
-            event.begin();
+            start = EventHandler.timestamp();
             write(b);
-            event.bytesWritten = b.length;
+            bytesWritten = b.length;
         } finally {
-            event.path = path;
-            event.commit();
-            event.reset();
+            long duration = EventHandler.timestamp(); // <-- bug here
+            if (handler.shouldCommit(duration)) {
+                handler.write(start, duration, path, bytesWritten);
+            }
         }
     }
The duration should have the start time subtracted from it.
This means that these events will generally overlap because end = start + duration makes a nonsense value.
The problem is compounded because the faulty duration will always exceed the latency threshold, which means these events flood JFR files to the extent they stress the parsing code.